People Activity
In: ICOST 2013, June 19-23, Singapore
Abstract. This work describes the use of smart homes to assess the health and wellbeing of people by measuring and displaying their activity at home. This is accomplished by the use of motion sensors, switches, pulse counters and touch screen displays. Pulse counters keep track of events and paths. An event is the triggering of a sensor, and a path is the distance between two sensors. There are counters for measuring positive and negative activities. Activities like walking, pedaling a static bicycle, and showering are displayed hourly, daily, and monthly with the same displays used for metering water and electricity. The activity patterns show hours of quietness, sleeping time, time without activity and their interruptions, like waking up in the middle of the night to go to the bathroom. Several hours of continuos inactivity during the day may trigger a panic call in the burglar alarm central, requesting a call back.
Keywords: Home Automation; Smart Homes; Wellbeing; Activity Monitoring
1 Introduction
Medical health systems are decreasing hospital rehabilitation days and, therefore, increasing the rehabilitation days spent at home. Consequently, there is interest at improving the monitoring of patients during the recovery time within the privacy of their homes. There is already, a senior housing facility that has used automation for Embedded Health Assessment [1] to detect changes in activity patterns to alert clinicians. Also, there are ongoing research projects to monitor [2], analyze walking speed [3], and prevent falls [4] using motion sensor devices.
In this manuscript, we describe how smart homes could be adapted for Embedded Health Assessment of people by monitoring motion sensors and metering electricity and water to make users, or their support system, aware of changes in health or behavioral patterns that may indicate a health problem. A smart home can log events related to people’s motion, use of lights, status of doors and windows, and utility usages. It is also capable of implementing actions, based on rules, resulting in sending e-mails, and/or originating calls when unusual pattern are detected. A touch display can help the user to control the several devices in the home and, simultaneously, show the correlation of the usage of utilities and other information related to user’s wellbeing. Health activities, that affect wellbeing, may also be part of a rehabilitation process, like walking between two distant rooms, walking on a treadmill, pedaling a static bicycle, or using the stairs instead of the elevator, which are considered positive activity.
Examples of negative activity are: going to the fridge during late hours in the night, using the elevator, walking in rooms with the lights off, and using electrical energy when there is not enough production of solar energy. In this paper we describe how a smart home was adapted to meter activities related to the wellbeing.
An unusual pattern of behavior can be considered an abnormal activity; for example, a person falling and non completing the path between two rooms. water running in the bathroom for unusually long period of time, or having doors or windows open that were supposed to be closed. A smart home should issue alerts when an abnormal activity is detected.
2 Implementation
Smart homes have sensors to trigger alarms during intrusions when the burglar alarm system is armed; but the same sensors can be used, while the burglar alarm system is unarmed, to control lights, sound buzzers, and sense events. Figure 1 shows the location and pointing direction of the six sensors in an apartment. S1 covers the elevator hall. S2 covers the stairs. S3 covers the access to the services area composed of kitchen and laundry rooms. S4 covers the access to living and dining rooms. S5 covers the presence in the corridor, and S6 covers the access to the entrance. An event is generated every time a sensor is triggered by motion.
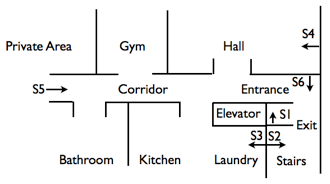
Fig. 1. A smart home with six motion sensors distributed over the house to trigger events.
Figure 2 shows the home automation implementation. The burglar alarm system initiates telephone calls in response to panic events. The energy system consists of Event and Path Counters, and Touch Screen Displays. Not shown in Figure 2, there are also current sensors (toroids) to measure the generation and consumption of electricity, and water meters to measure the irrigation and house water, separately. All the accumulated values in the counters are shown in histograms by hours, days, and months, using the same Touch Screen Display or the Web Server. The automation system consists of Controller, Web Server, Touch Screen, Activity Switches, Relays, and wall commands not shown in Figure 2.
The Controller has scenarios that convert events into actions with rules. Some of the scenarios are used to build timers needed to trigger a panic call by closing a Relay to actuate the Panic Switch. Other scenarios convert the pulses from the sensors into commands for the Activity Switches to increment Event Counters and Path Counters. While Event Counters meter every time a user passes in front of a sensor, Path Counters meter the number of times a user passes in front of a pair of sensors during a time interval. The automation system has a Web Server used for remote monitoring of Counters and for sending e-mails after an event created by the Controller.
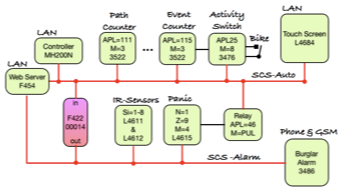
Fig. 2. The smart home has Burglar Alarm and Automation Systems with a Touch Screen Display, Sensors, Switches, Web Server and Controller. There is an interface, F422, to interconnect the SCS-automation bus with SCS-Alarm bus.
The Controller has variables (counters and booleans) used to implement time-out functions in scenarios, to detect periods of inactivity, before actuating the Panic Switch. For example, to create a 2-hour time-out counter, a counter variable is set to a value of 12 every time that there is a new event. This counter is decremented every 10 minutes until it reaches zero (2 hours without events), when it triggers a scenario to generate a signal for the burglar alarm central to call for help by dialing several phones, in sequence, until it gets an answer. The algorithm for this time- out counter is implemented by the following scenarios:
- SCEN1: # An activity is detected from sensor Sx for x=1 to 6 When Sx=ON Execute Counter1=12
- SCEN2: # 10 min at 01,11,21,31,41,51 of any hour When Time=”**/*1” Execute Counter1=(Counter1 - 1)
- SCEN3: # after 2 hours of inactivityWhen Counter1 = 0 Execute Panic=1; Delay=1sec; Panic=O
Lack of motion during unexpected hours may generate a panic call. For example, a service person did not show up for work as expected. The length of the period for the down counters is preset in the scenarios, but different scenarios can be enabled/disabled using the Controller web interface. Different periods of inactivity may be set to account for sleeping and resting times. Some of the triggering events may be related because they happen simultaneously or sequentially over a period of time; therefore, the controller may trigger a panic call only when one of the two events happens. For example running the water while the burglar alarm is armed, and all lights are OFF.
An Event Counter meters all activity generated by each motion sensor; but, using the touch screen display, or the burglar alarm central, sensors can be disabled by deselecting their zones of pertinence. Figure 5 shows an Activity Switch that was directly connected to a dry contact of a static bicycle to account for the rotation of its wheel during a daily exercise. The number of wheel turns should increase with the number of training days, as users get better trained. There is also an additional Event Counter to meter quite time. The Touch Screen Display can show up to two years history for any Counter.
Path Counters are impulse counters that count sequential events. Paths are useful to measure magnitude and direction of movements. Every completed path increases its counter. There may be counters for positive and negative paths, and they may be displayed in a graph with opposite signs. A panic call may be triggered when the pair of events is not completed during an expected time interval.
The algorithm of a path is defined by two scenarios, implemented by sensors S5 and S3, to account for a walk along the corridor to the Kitchen shown in Figure 1.
- SCEN4: # First sensor event
When S5=ON Execute Boolean5=True - SCEN5: # Second sensor event increment counter by 1
When S3=ON Only_IF Boolean5=True Execute ActivitySwitch=0.5sec, Boolean5=False
A single Path Counter is used to add several paths of different walk distances. For example, in a walk from the Private Area there several paths, therefore, we use 1 pulse for a 4 meter walk to the Kitchen, S5-S3; 2 pulses for an 8 meter walk to the Hall S5-S4; and 3 pulses for a 12 meter walk to the Entrance, S5-S6. Four additional Path Counters are used to account for the two exits and entrances to the home (stairs and elevator). EXITS: S6-S1 when using the Elevator, and S6- S2 when using the Stairs. ENTRANCES: S1-S6 when using the Elevator, and S2-S6 when using the Stair.
3 Wellbeing
The objective of this work is for users to review, measure, and improve their wellbeing in the privacy of their homes. Once the energy system is in place, it is quite simple to adapt the pulse counters to monitor people’s activity and explore how changes in life style may impact their wellbeing. For example, a single Touch Screen display enables users to observe their sleeping patterns by showing graphically motion, and energy and water consumption during the night.
The generation of electrical energy from solar cell panels is also a kind of wellbeing; because, it generates income by selling energy to the grid, increases user savings by using alternative energy. A single solar cell panel, 100 Wp, 12 VDC system, charges the backup batteries for the home automation system, so our smart home does not require more electrical energy, from the grid, than a conventional home. There is also a 6 kWp, 230 VAC solar cell panel system to lower the cost of running the electrical appliances, and to generate electricity for the grid, during the day, when the appliances are not used. Figure 3 shows a terrace of the apartment with solar cell panels and the generated energy on a sunny day. A smart home has metering capabilities to display generations and consumption of electricity to help users to sync their energy usage habits with the generated alternative energy to avoid expensive energy bills.
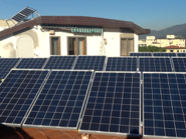
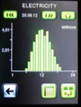
Fig. 3. Above: the terrace and roof are used for solar cell generation systems. Below: graph showing histogram of the generated energy in kWh during a sunny day on June 20, 2012.
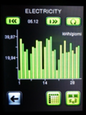
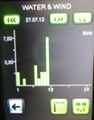
Fig. 4. Above: touch screen showing energy generated daily during May 2012. Below: water consumption on July 27, 2012 indicating waking up in the middle of night.
The Touch Screen display is the main user interface to the home. Users control their home, learn how much and when alternative energy is generated, study weather pattern (wind and temperature), and keep a history of their physical activity and sleeping patterns. Figure 3 (right) shows the energy generated during a day. Figure 4 (left) shows the energy generated during the
month of May, 2012. Figures 4 (right) shows the water consumption during a day. It shows a water consumption the middle of the night and an outing for the rest of the day, starting at 11:00 AM. Figure 5 (left) shows the static bicycle used to exercise and the display (right) showing the average hourly event activity during November 2012.
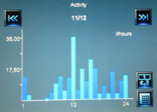
Fig. 5. Above: stationary bicycle with contact that closes and opens at every wheel rotation. Below: display showing average daily activity for the month of November 2012.
The smart home has also a network camera that sends an e-mail with images every time a person approaches the top of the stairs. The images show the days a person has balance, motion and postural problems. The idea is to have a type of “Time Machine” to see and explore people evolution within the privacy of their homes, and be alerted of unexpected habits to prevent future health problems.
3 Conclusions
A smart home can record and display values related to people activity continuously. Users may review the data accumulated in pulse counters, during a period up to 2 years, in the privacy of their homes. The data collected can be displayed locally, using the touch screen display, or remotely, using the web server. With this implementation, we demonstrated the capability of smart homes to collect data inconspicuously to keep track of user activity, rehabilitation, and changes in user normal conditions. Further work is needed to analyze the data collected to created models and applications for wellbeing.
References
- Skubic, M., Guevara R. D., and Rantz M.: Testing Classifiers for Embedded Health Assistant, In: Donally, M. et al. (Eds.) ICOST 2012, LNCS 7251, pp 198-205, 2012
- Allègre, W., Burger, T., Berruet, P., and Yean-Yves, A.: A Non-intrusive Monitoring System for Ambient Assisted Living Service Delivery, In Donally, M. et al. (Eds.) ICOST 2012, LNCS 7251, pp 148-156, 2012
- Kaye, J., Mattek, N., Dodge, H., Buracchio, T., Austin, D., Hagler, S., Pavel, M., and Hates, T.: One Walk a Year to 1000 with a Year: Continuous In-home Unobtrusive Gait Assessment of Older Adults, In Gait Posture, 2012 February: 35(2): 197-202
- Mellone, S., Tacconi, C. L.Schwickert, J. Klenk, Becker, C., and Chiari, L.: Smartphone- based solutions for fall detection and prevention: the FARSEEING approach, In: Zeitschrift fur Gerontologie und Geriatre, Volume 45, Issue 8, pp 722-727